Ad Creative Fatigue: What Competitor Rotations Tell You About Your Own Refresh Cadence
Learn how to spot ad creative fatigue by tracking competitor ad rotations, estimate refresh cycles and set a smarter creative cadence for your campaigns.
Chris Edington
15 min read

Ad Creative Fatigue: How to Use Competitor Ad Rotations as a Benchmark
You can't see a rival's frequency or CTR. What you can see is how long their ads stay visible, when they disappear, and which concepts keep coming back. That makes a free (if rough) reference point for ad creative fatigue. If ads in your category tend to stay live for six weeks or more and you're swapping creative every fortnight (or the reverse), you may have a cadence question worth investigating.
The approach is simple. Track rotations week over week, work out the market's rhythm, then use it to sense-check your own refresh schedule and creative backlog. One caveat, and I'll only really make it once: competitor timing gives you hypotheses, not answers. Your own frequency, CTR and CPA trends always get the final say.
Here's how I'd do it, step by step.
What ad creative fatigue looks like from the outside
First, a quick definition. Ad creative fatigue is what happens when the same audience sees the same ad too often. Frequency climbs, click-through rate drops, and cost per acquisition creeps up. Inside your own account, that's a dashboard problem. Looking at a competitor, you only get half the picture.
Public sources like the Meta Ad Library and Google's Ads Transparency Center show creative, copy and (in some cases) when an ad started running. They don't show spend, targeting, frequency or results for ordinary commercial ads. So you can't diagnose a rival's fatigue directly. What you can read are behavioural fingerprints: when ads first appear, when they vanish, and how often a concept returns in a new form.
Picture this. A rival's hero video appears in week one. By week three it's gone, replaced by a near-identical hook with a new opening frame. Was the first version fatigued? Maybe. Or maybe they were testing openings all along. Either way, you've learned something about their tempo.
Three competitor ad rotation signals to watch
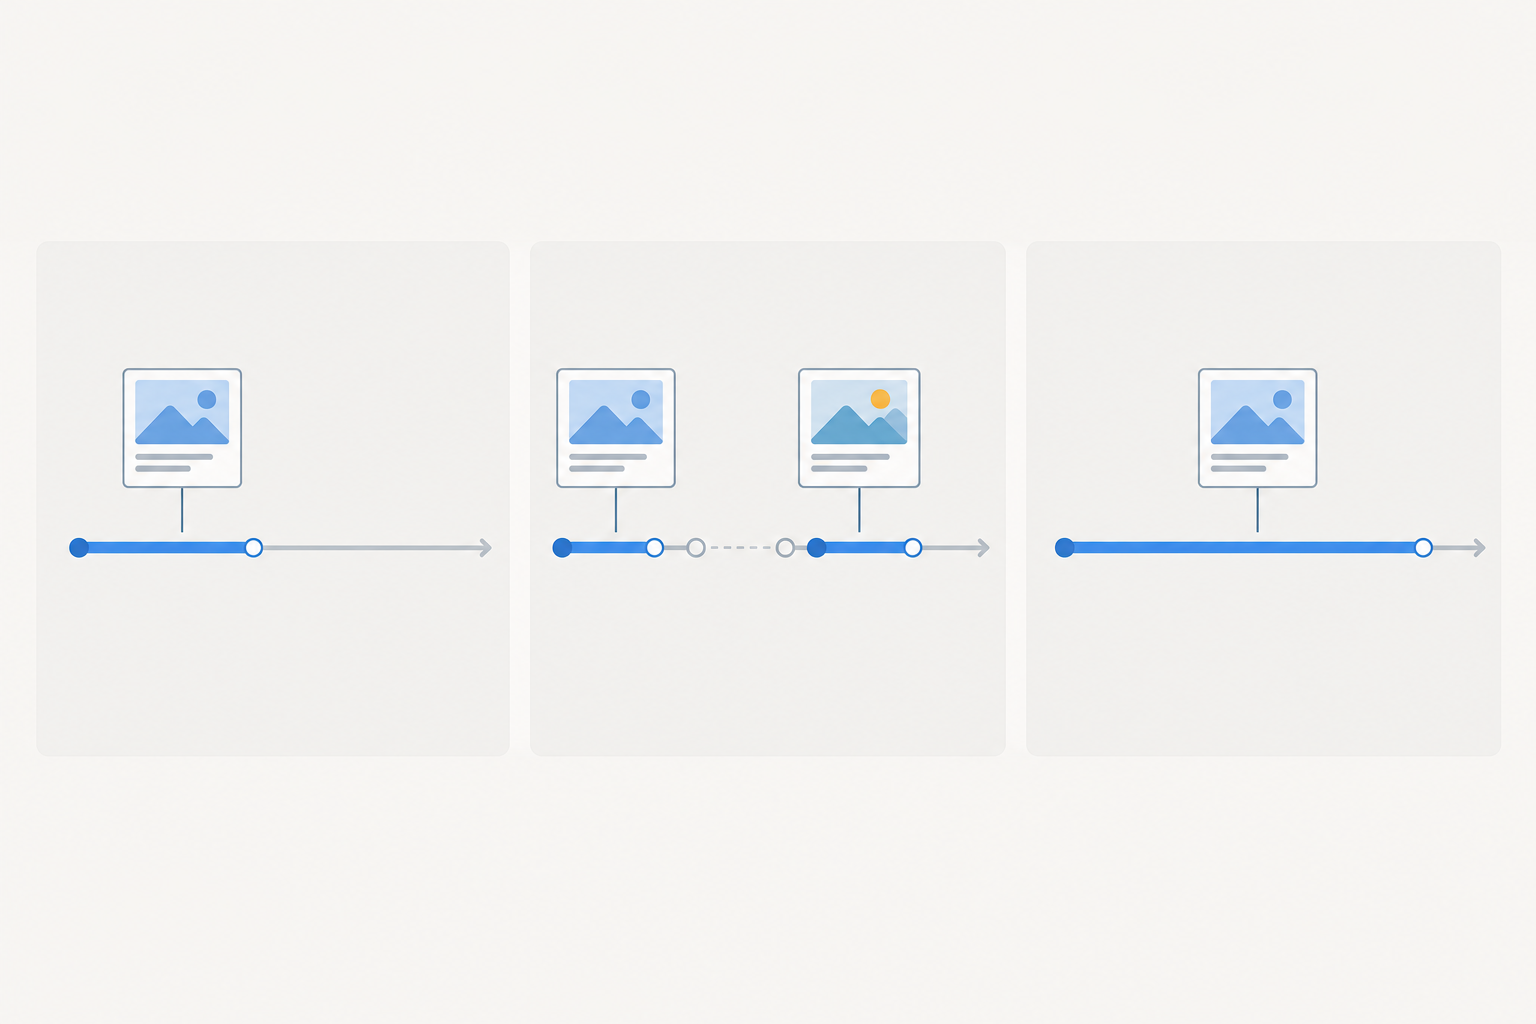
- Ads that disappear early. Short runs can point to a failed test, a creative that wore out fast, or simply a budget change.
- Ads relaunched with small tweaks. Same concept, new hook, image or CTA. This often means the advertiser sees something worth keeping, though it could equally be routine iteration.
- Ads that keep showing for months. Sometimes that's a durable performer, sometimes an ad nobody has got round to switching off (more on that shortly).
Why one competitor ad rotation can be misleading
A stopped ad doesn't automatically mean fatigue. Budgets shift, seasonal offers end, products sell out and compliance teams step in. The reverse holds too: a visible ad isn't necessarily getting meaningful delivery. So look for patterns across several ads and several weeks.
There's also a practical limit. The Meta Ad Library and similar sources mostly show what's live right now, without tidy history or diffs. You need to take your own snapshots, by hand or with a monitoring tool.
How to measure competitor ad refresh cycles
You can do this in a spreadsheet. It's a bit tedious, but it works, and it'll teach you what to look for.
- Pick 3-5 direct competitors, plus one or two aspirational brands. Keep the market, platform and placement consistent so you're comparing like with like. If you're UK-focused, filter to UK activity where the platform allows it. Google's Transparency Center, for example, lets you filter by location.
- Log first-observed and last-observed dates for every creative. Check weekly and record every active ad, plus platform, format, market and a short concept label. Be honest about what these dates are: if you check every Monday, an ad that vanishes between two checks could have stopped on any day in that gap. Your 'lifespan' is an observed range, give or take up to a week at each end, not a verified launch-to-stop figure. Some libraries do show a start date, which helps on the launch side, but the stop date is still an estimate.
- Count new ads per week. That's a proxy for your rival's refresh rate: how many genuinely new creatives appear in a given week. Also note what share of their visible library is new versus continuing.
- Group by format: static, video, carousel, UGC-style, and text-only for Google and LinkedIn. Formats often rotate at different speeds, which shows where a rival is putting its creative effort.
- Flag near-duplicates as iterations. Same copy with a new image, or same visual with a new hook, counts as one concept with variations, not a brand-new idea. Otherwise routine resizes and headline edits will inflate your estimate of how fast they're refreshing.
- Use medians, not averages. One ad that's been visible for 14 months will wreck an average. Report the median observed run and, if you can, a range. Track ads that disappear and later return separately.
A tidy output looks something like this. (These numbers are purely illustrative, so please don't treat them as category benchmarks.)
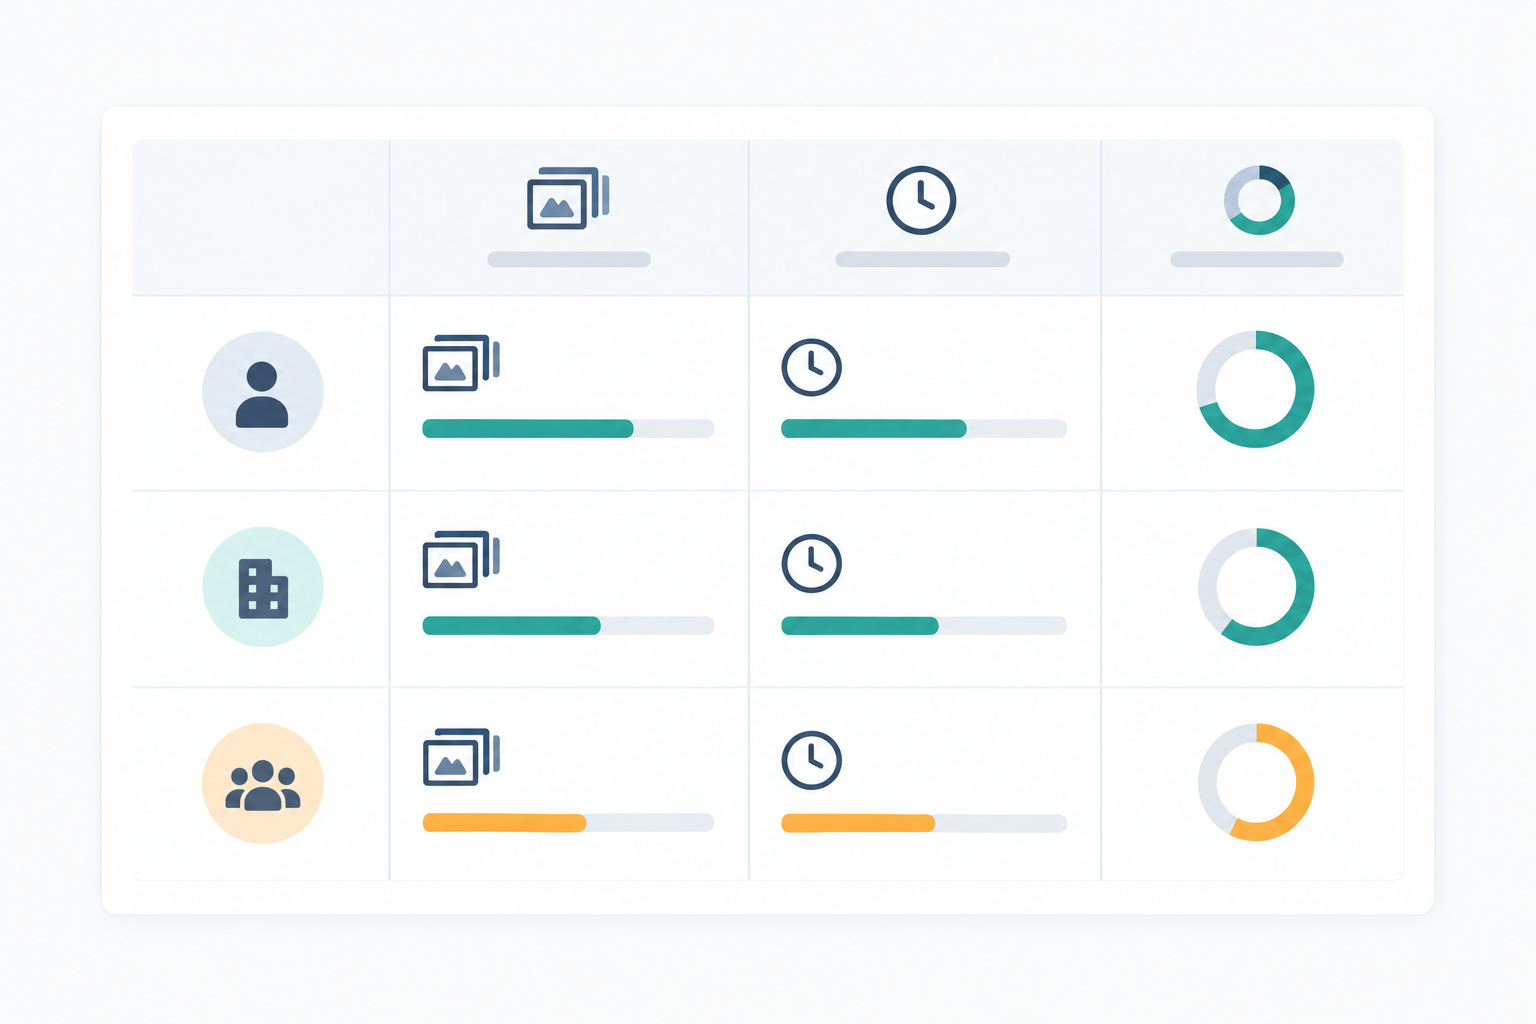
| Competitor | New ads per week | Median observed run | Ads observed for 30+ days |
|---|---|---|---|
| Rival A | 6 | ~12 days | 15% |
| Rival B | 3 | ~31 days | 42% |
| Rival C | 1 | ~58 days | 70% |
Rival A is burning through creative. Rival C is running a handful of long-lived ads. Neither is necessarily 'right', but the spread shows what the market seems to tolerate.
A worked example of tracking competitor ad rotations
Say you track one rival for six weeks. In weeks one to three, they launch four new video ads a week, and most are gone by week four. In weeks four to six, new launches drop to one a week, but two ads from week two are still visible, and a third appears in three slightly different versions.
What can you reasonably say? That they ran a burst of testing, then narrowed down. What can't you say? That the surviving ads performed well, or that the variants have more budget. A fair conclusion is: 'This rival tested heavily for three weeks, then settled on a few concepts. We should look at what those concepts have in common and check whether our own testing window is similar.' That's a hypothesis you can act on without pretending to know their results.
Which competitor ads survive the longest?
Longevity is one of the few publicly visible clues about an ad, but it's a weak one. A long-running ad might be a strong performer, or it might be low-spend, evergreen, or simply forgotten. Libraries don't show spend or results, so treat long-runners as things to investigate, not proof of a winner.
Still, when I look at long-running ads, the same patterns keep turning up:
- A clear single-message hook. One idea, stated fast. No five-benefit pile-ups.
- Native-feeling UGC or founder-led video that looks like content rather than an advert.
- Strong offer framing, meaning a clear reason to act or a guarantee that removes risk.
- Evergreen problem/solution angles. 'Sore back from sitting all day' doesn't expire the way a seasonal promo does.
- Multiple variants of one concept. That suggests the advertiser is still testing or extending the idea, though it doesn't tell you how much they're spending.
It's also worth remembering that long-lived creative is often a durable idea rather than one unchanged asset. Apple's 'Shot on iPhone' has supported countless executions. A rival's persistent theme can tell you more than the lifespan of any single ad.
Beware the zombie ad
Some ads run for months simply because nobody switched them off. To spot them, cross-check. Are new ads launching alongside it? Are there copy variations? Is the offer still current? If the old ad is sitting alone with an expired promo, it's probably a zombie, not a champion.
Audience size changes the story
How long an ad stays visible depends heavily on who's being targeted. Niche B2B LinkedIn ads often run longer than broad-reach consumer TikTok ads, but that's not because they're better. The context is different, so compare like with like.
Turn competitor ad research into a swipe file (without copying)
Build a swipe file of angles worth testing: the problem being addressed, the proof used, the format, the offer. Then make your own version with your own brand, product and proof. Meta's guidance on creative diversification is a handy reminder here. Test genuinely different approaches rather than superficial variations.
Do all platforms fatigue at the same rate?
Short answer: no. Longer answer: there's no dependable, universal number of days after which creative fatigues on any platform. Audience size, spend, placement, objective and format all matter as much as the platform does. The table below is a set of starting hypotheses based on what I'd expect to see, not a sourced industry benchmark. Check it against what you actually observe in your own category.
| Platform | Rotation pattern I'd expect to see | Likely fatigue driver | What to watch in competitor activity |
|---|---|---|---|
| Meta | Faster in high-spend ecommerce and DTC accounts; slower elsewhere | Audience saturation | New-ad volume per week, iterations of recurring concepts |
| TikTok | Often high volumes of new creative with shorter runs | Fast-moving trends and formats | New hooks, creator styles, opening seconds |
| Google: search | Often slower; text changes can happen quietly through asset swaps | Message staleness | Headline and description changes |
| Google: display and video | Closer to social behaviour | Audience saturation | Image and video refreshes |
| Often fewer creatives running for longer | Small audiences building frequency | Offer shifts, content type changes, ad pauses |
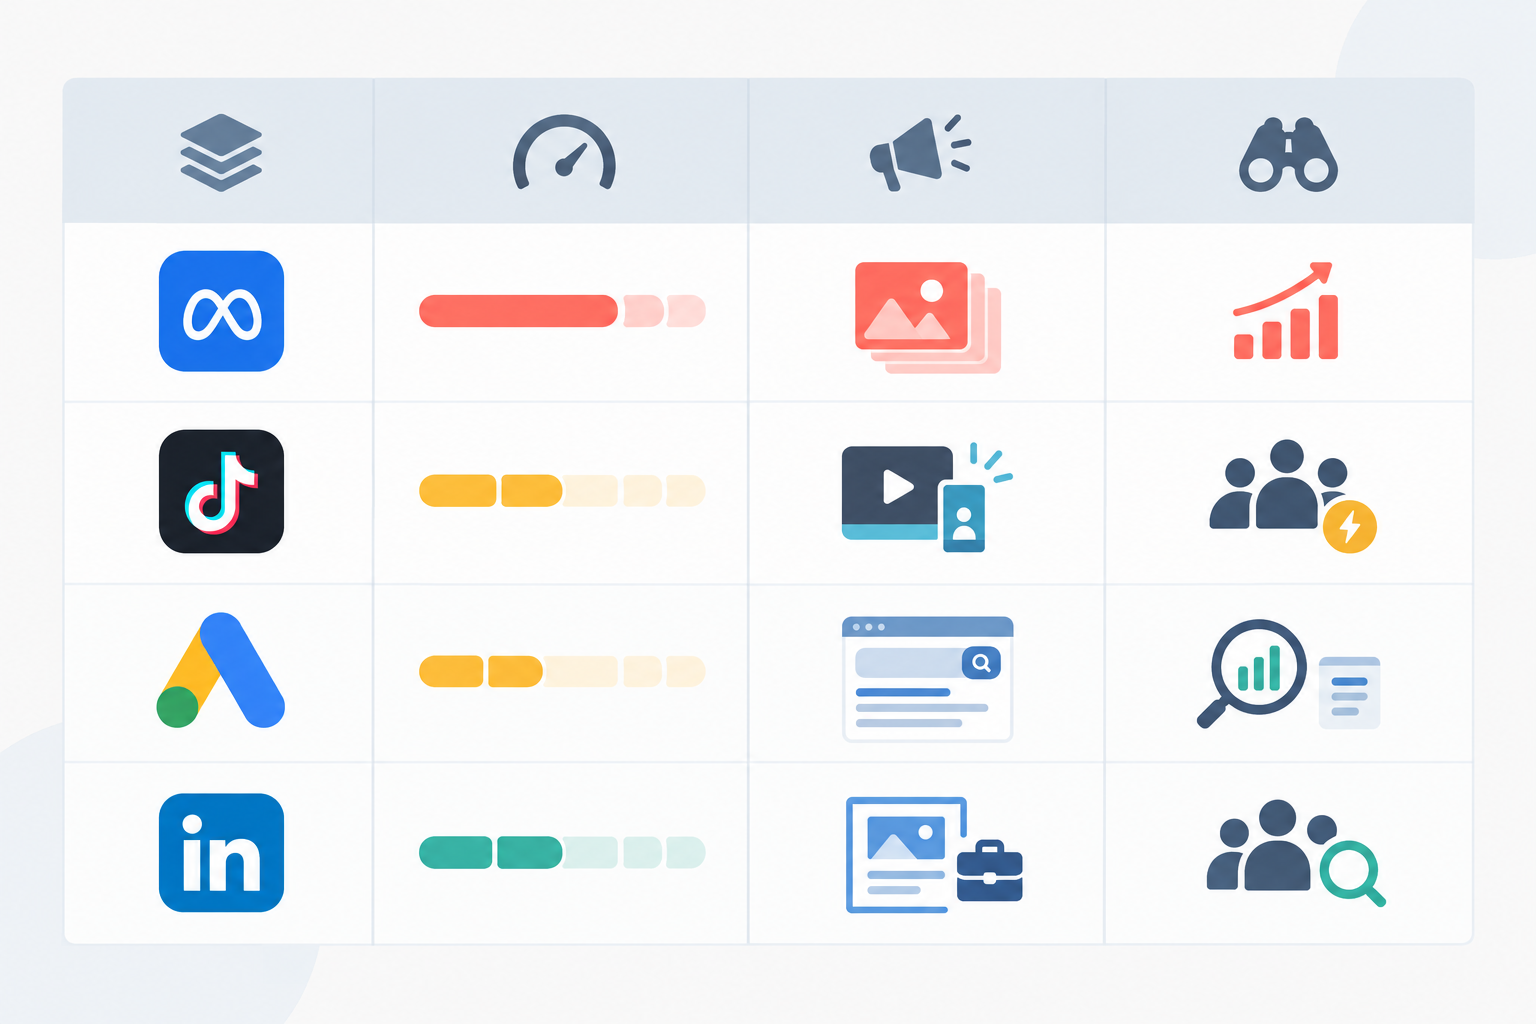
A few platform specifics. TikTok's creative guidance leans on native video style and varied executions, so a proper refresh means changing the hook, pacing or creator approach, not just reposting with a cosmetic edit. On Google, responsive search ads support up to 15 headlines and 4 descriptions, so a text refresh can happen without any visible 'relaunch'. That makes search cadence harder to read from the outside. On LinkedIn, smaller defined audiences mean frequency can build quickly, yet B2B brands often run a tight set of creatives rather than constantly cycling.
UK-specific considerations for ad creative fatigue
If you're advertising in the UK, smaller addressable audiences in some niches (local services, specialist B2B, regional retail) can mean faster saturation than the same spend would cause in a bigger market. Seasonal moments distort rotation too. Expect bursts around Black Friday, the January sales and Q4 B2B budget pushes, then a quieter spell. Don't mistake a seasonal spike for a permanent change in cadence.
Setting your own ad creative rotation cadence
Now the fun bit: turning all this into your own rhythm.
Start from the benchmark. If the median observed run in your category is, say, five weeks, you might set your default review window a little inside it, maybe three to four weeks. You're not copying anyone. You're checking you're not wildly out of step.
Then combine external and internal signals. Competitor timing is the outside view. The inside view comes from your own account. Treat these as prompts to investigate, not automatic triggers:
- Frequency rising in prospecting. Many people start looking around 3, but the right level depends on your objective, audience size, placement and spend.
- CTR declining over several days compared with that ad's own earlier performance.
- CPA creeping up against your own baseline.
Frequency is an average (impressions divided by reach), and rising frequency alone doesn't prove fatigue. Read it alongside CTR, conversion rate and cost per result, and make sure you have enough conversion volume to trust the trend.
Refresh by spend, not by calendar. A high-spend ad set can burn through an audience in days, while a small one might be fine for two months. Review high-spend ad sets more often and let low-spend ones breathe.
New concept or iteration?
When performance wobbles, you've got two moves.
- Iterate on a winner: new hook, new first three seconds, new CTA, new format. This is good when the core idea still works.
- Rotate in a fully new concept: a different angle, proof point or offer. This is better when the whole idea feels tired, or you're hitting a ceiling.
A practical method is to keep a control creative and test a meaningfully different challenger against it, giving it enough delivery and conversion data before you judge. Don't call a winner from a wobble on day two.
Don't just match their pace
Matching a rival's tempo isn't always the goal. Sometimes a slower, higher-quality cadence is your differentiator. And sometimes a rival's frantic cadence just means they're struggling to find something that works. If a rival goes quiet or pauses ads, that can be a window to push harder on shared audiences.
How often should you refresh ad creative?
Here's a practical starting range. These are my suggested hypotheses to test against your own data, not industry standards:
- TikTok and Meta: review weekly, and plan new concepts every 2-4 weeks, sooner at high spend.
- LinkedIn and Google: review fortnightly or monthly, and plan new concepts every 4-8 weeks.
- Small or niche audiences on any platform: shorten the window, because frequency builds faster.
Building an ad creative pipeline and sizing your backlog
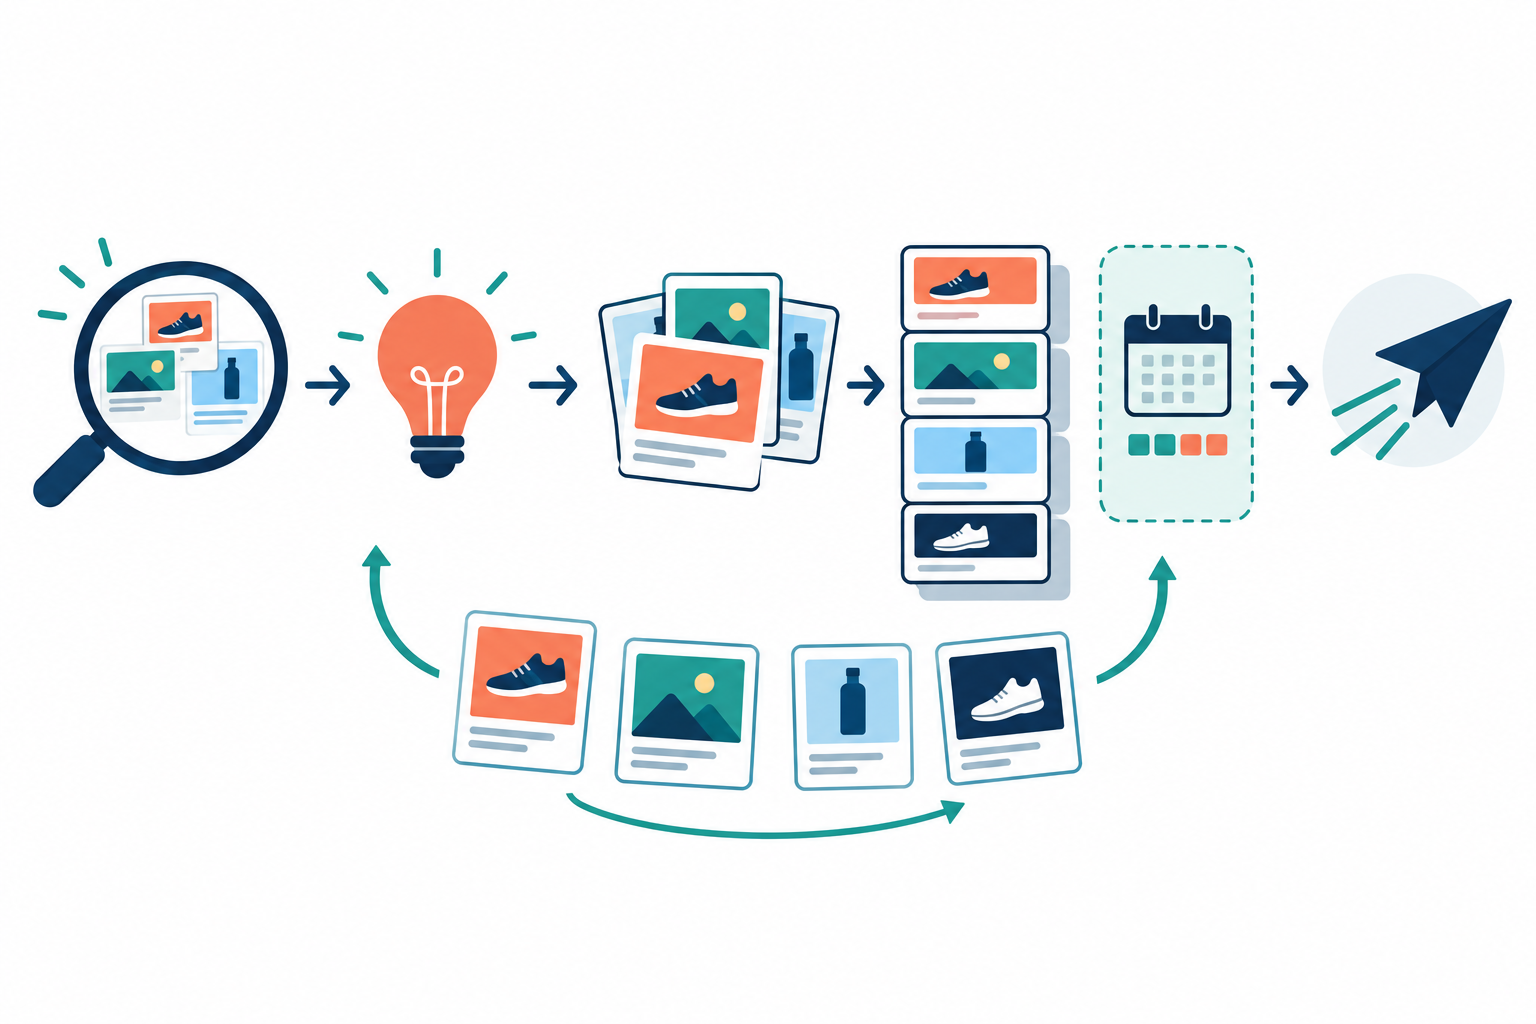
A cadence is only as good as the creative you can actually ship. Here's how I'd build the pipeline.
- Work backwards from cadence. If you want X new ads per week per platform, you need X ready to go, plus a buffer for the inevitable stinker.
- Size your backlog. As a starting point, I'd hold 3-4 weeks of ready-to-launch creative for fast platforms like TikTok and Meta, and 1-2 months for slower LinkedIn and Google. Scale it up with heavier spend or smaller audiences.
- Use a concept-to-variant structure. One concept should spawn several hooks, formats and CTAs. That keeps production efficient and makes learning cleaner.
- Mix formats: static, short video, UGC, carousel, plus platform-native versions. A TikTok-native cut will often work better than a repurposed Meta ad.
- Feed competitor insight into the front of the pipeline. I use three buckets: angles rivals seem to have retired, angles they keep returning to, and angles nobody is running yet. The third bucket is often the most interesting.
- Tag every concept by angle, format, hook type and offer. Without tags you can't learn from what you've shipped.
Common creative pipeline mistakes
- One big batch each quarter. Fine until week five, when everything's tired and you've nothing in the tank.
- Ignoring creative that's already tired. Hope isn't a refresh strategy.
- No tagging. You'll repeat losing ideas and forget winning ones.
Tracking competitor ad rotation over time
One snapshot is misleading. You might catch a rival mid-sale or mid-test and think it's their normal state. Weekly data helps you separate real patterns from seasonality.
A monthly log should include:
- New ads observed
- Median observed run
- Percentage of ads continuing from the previous month
- Format mix
- Offer or angle shifts
Spotting a competitor strategy change
The big shifts are usually obvious once you're tracking: a sudden spike in new creatives, a swing from static to video, or a mass shutdown of ads. Any of these can signal a new campaign, new positioning or a budget decision. Annotate them, because three months later you'll have forgotten.
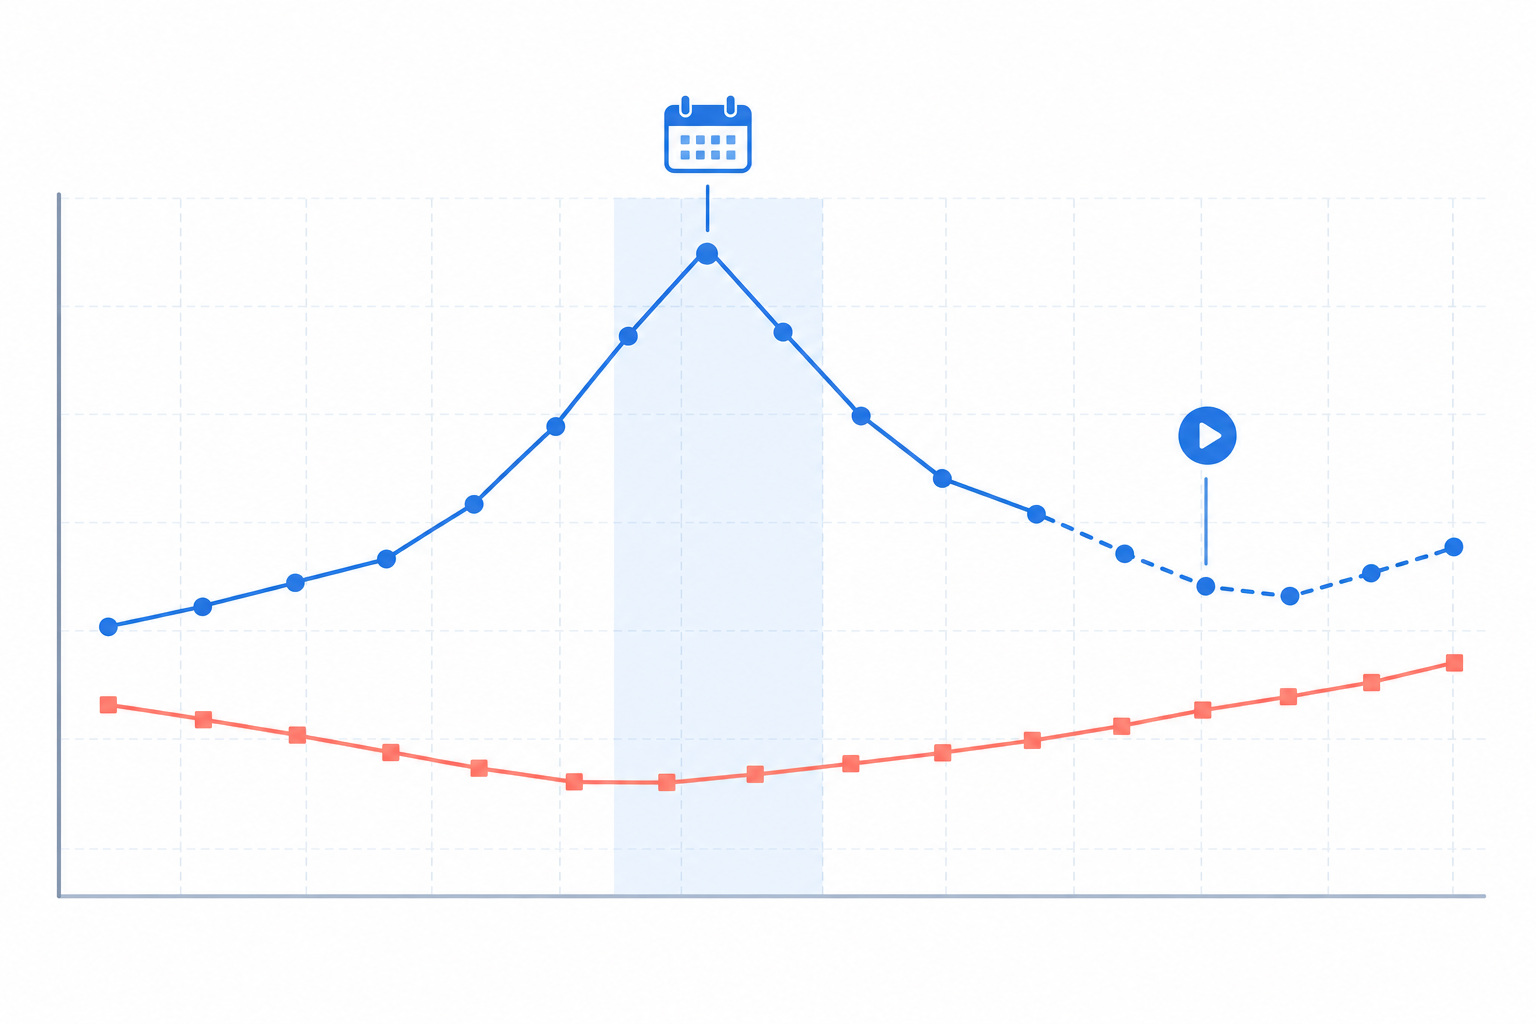
Make competitor ad tracking a 15-minute Monday ritual
This shouldn't turn into a research project. Once the spreadsheet is set up, Monday's job is just to scan what's new, what's disappeared and what's still showing, then add a line to your log. Fifteen minutes, done.
A monthly competitor ad review template
Keep it to three questions:
- What did rivals change? Think new concepts, retired ads and format shifts.
- What does that mean for our cadence? Are we faster, slower or about right?
- What will we test next? Pick one or two specific experiments, each with a hypothesis.
If you'd rather not do the snapshots by hand
A quick disclosure: Rival Ads is our product, so weigh this accordingly. You give it a competitor's website and it finds their presence across Meta, Google, TikTok and LinkedIn, then collects their active ads weekly and shows what's new, what's stopped and what's unchanged since last time. It needs no ad account connections, sends a weekly email digest and starts at $29/month. That covers the logging in steps 2 and 3 above. The interpretation still needs your judgement and your own performance data, whether you're deciding if a pattern means fatigue, testing or a budget cut. A spreadsheet works fine if you prefer it.
One more note on sources: TikTok's Creative Center Top Ads is a discovery tool for selected high performers, not a full archive. It's good for inspiration but no use for calculating anyone's cadence.
FAQ: Ad creative fatigue and competitor ad rotations
How often should I refresh ad creative?
There's no single number. As a starting hypothesis, review weekly and plan new concepts every 2-4 weeks on TikTok and Meta, and every 4-8 weeks on LinkedIn and Google. Then let your own frequency, CTR and CPA trends decide.
How do I know a competitor's ad is fatigued?
You can't know for certain without their data. Warning signs include ads disappearing after a short run, the same concept relaunching with a new hook or image, and a stream of near-duplicate variants. Treat these as signals to investigate.
Do all platforms fatigue at the same rate?
No. Rotation looks different on TikTok, Meta, Google and LinkedIn, and even within Google, search behaves differently from display and video. Audience size, spend and format matter as much as the platform.
How big should my creative backlog be?
As a starting point, around 3-4 weeks of ready-to-launch creative on fast platforms and 1-2 months on slower ones, plus a few spare concepts. Go bigger if you spend heavily or target a small audience that saturates quickly.
The takeaway: use competitor ad rotations to benchmark creative fatigue
Ad creative fatigue is hard to see from the outside, but rival rotation is easy to measure once you track it consistently. Log first-observed and last-observed dates, count new ads, group by format, use medians, and read patterns over weeks rather than days. Then set your cadence from your own performance data, using the market's rhythm as a sense check rather than a script.
Do that for a few months and you'll stop guessing when to refresh. You'll have a creative pipeline that actually fits your category. 🎯