
Decoding Ad Frequency: How to Estimate Competitor Ad Budgets Without Seeing Their Account
Learn how an ad spy tool uses public signals like run duration, placement breadth, and creative iteration to prioritize competitor angles.
Chris Edington
15 min read
How to Use an Ad Spy Tool to Estimate a Competitor's Ad Budget (Without Seeing Their Account)
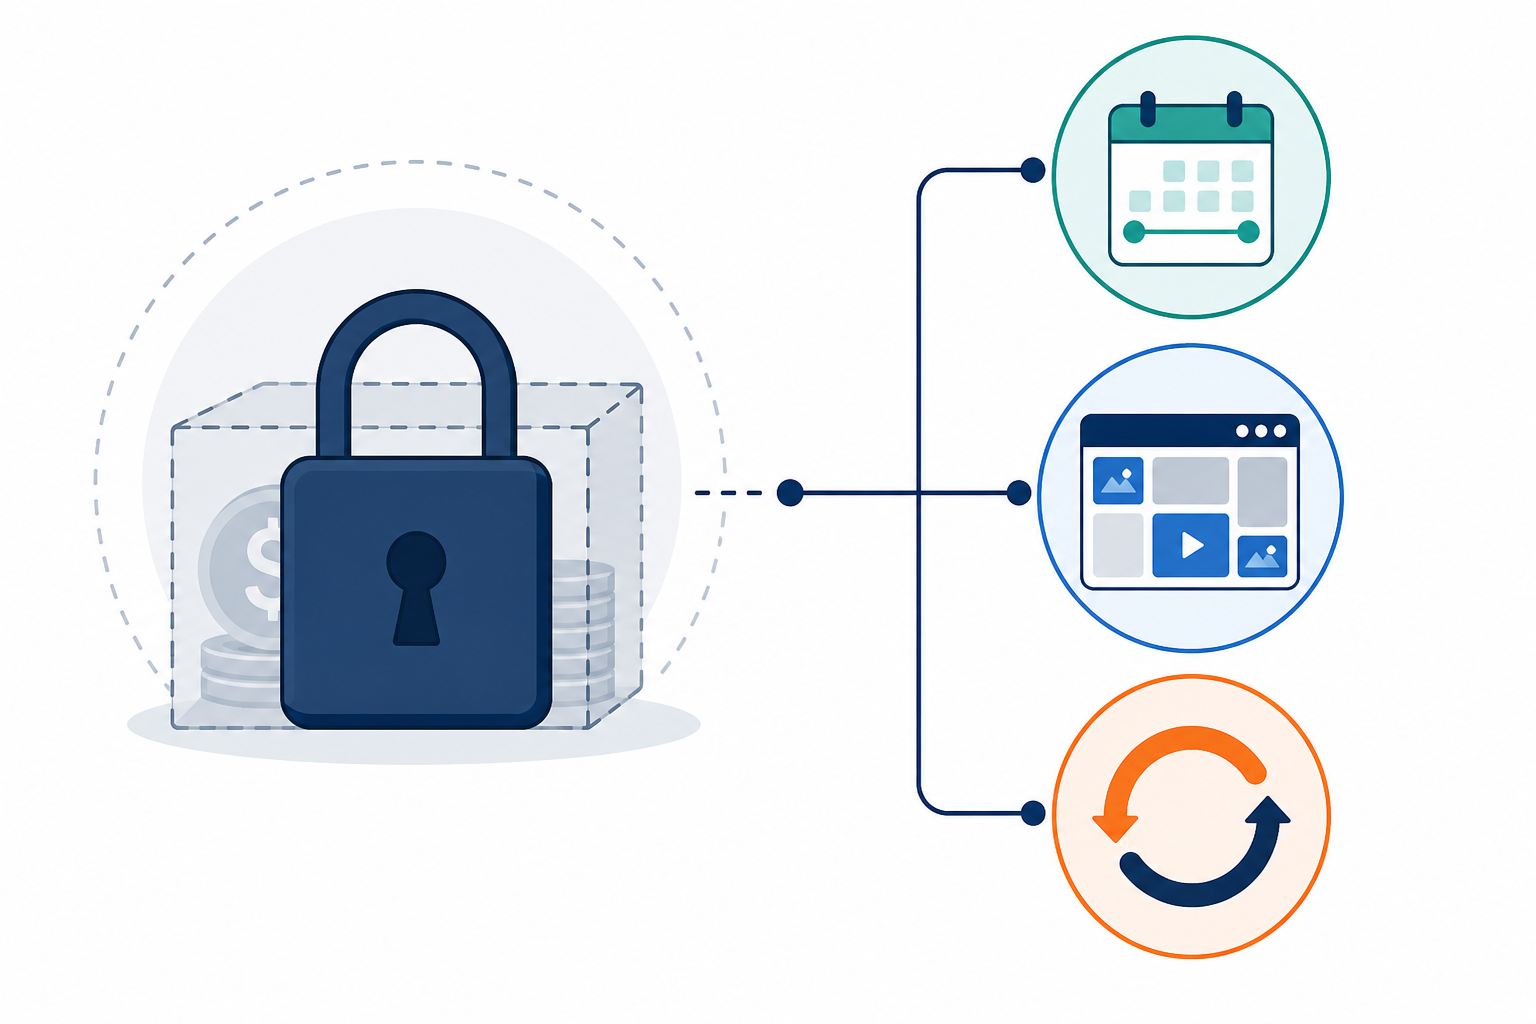
You can't see a competitor's exact ad spend. Meta, Google, TikTok and LinkedIn all keep that number locked away, and no ad spy tool has a backdoor into someone else's Ads Manager, no matter what its dashboard implies. But here's the good news: you don't need the exact figure to make a good decision. You need to know whether an angle is worth testing, and that's a different question entirely.
A good ad spy tool earns its keep by helping you collect and compare the signals that actually are public: how long an ad has run, how many platforms and placements it appears on, and how often the creative gets refreshed. Put those three together into a simple score, and you get a directional read on which competitor angles deserve your team's attention this week, and which are probably just noise from someone else's testing budget. Not a pound figure. A read.
Let me walk through how this works, including where it breaks down and what it genuinely can't tell you.
Why you can't see exact ad spend, but can estimate budget allocation
If you've spent any time in Meta's Ad Library, Google's Ads Transparency Center or TikTok's Creative Center, you already know the frustration. You can see the ad. You can see the copy. Sometimes you can see when it started running. What you can't see, ever, is what they're spending on it.
That's by design. Platforms guard advertiser spend data closely because it's competitively sensitive — it would let rivals reverse-engineer entire media strategies overnight.
This is also why I'd treat third-party "spend estimate" numbers with real skepticism. Tools that claim to calculate a competitor's monthly ad spend are usually working backwards from estimated impressions, which sounds clever until you remember impressions don't account for bid strategy, audience overlap, seasonality, or the dozen other variables that actually determine cost. I've seen these estimates be wildly off, which gives you a false sense of precision. That's arguably worse than having no number at all.
Coverage also varies by platform and region. Meta's Ad Library is fairly comprehensive, but TikTok's Creative Center and Google's Ads Transparency Center have gaps, and UK-specific ads sometimes lag behind global rollouts or don't get indexed at all. If you can't find an ad, that just means you couldn't observe it. It doesn't mean it isn't running.
So instead of chasing a number you can't get, focus on what's actually observable:
- When an ad started and how long it's stayed live
- Where it appears — which platforms and placements
- How often the creative changes — new hooks, new visuals, new copy
Think of this as triangulation, not proof. You're not trying to land on "they're spending £14,000 a month on this." You're answering a more useful question: is this angle proven enough that I should pay attention to it? None of these three signals tell you cost. They tell you whether an advertiser is behaving like someone who's found something that works. Useful, but still a proxy.
Evergreen retargeting ads, low-spend brand-awareness campaigns, and creative that's simply been forgotten in an account can all produce the exact same surface signals as a scaled winner. Keep that in mind as we go through each one below.
What ad run duration tells you about budget confidence
Of the three signals, run duration is the easiest to read — though it still needs careful interpretation.
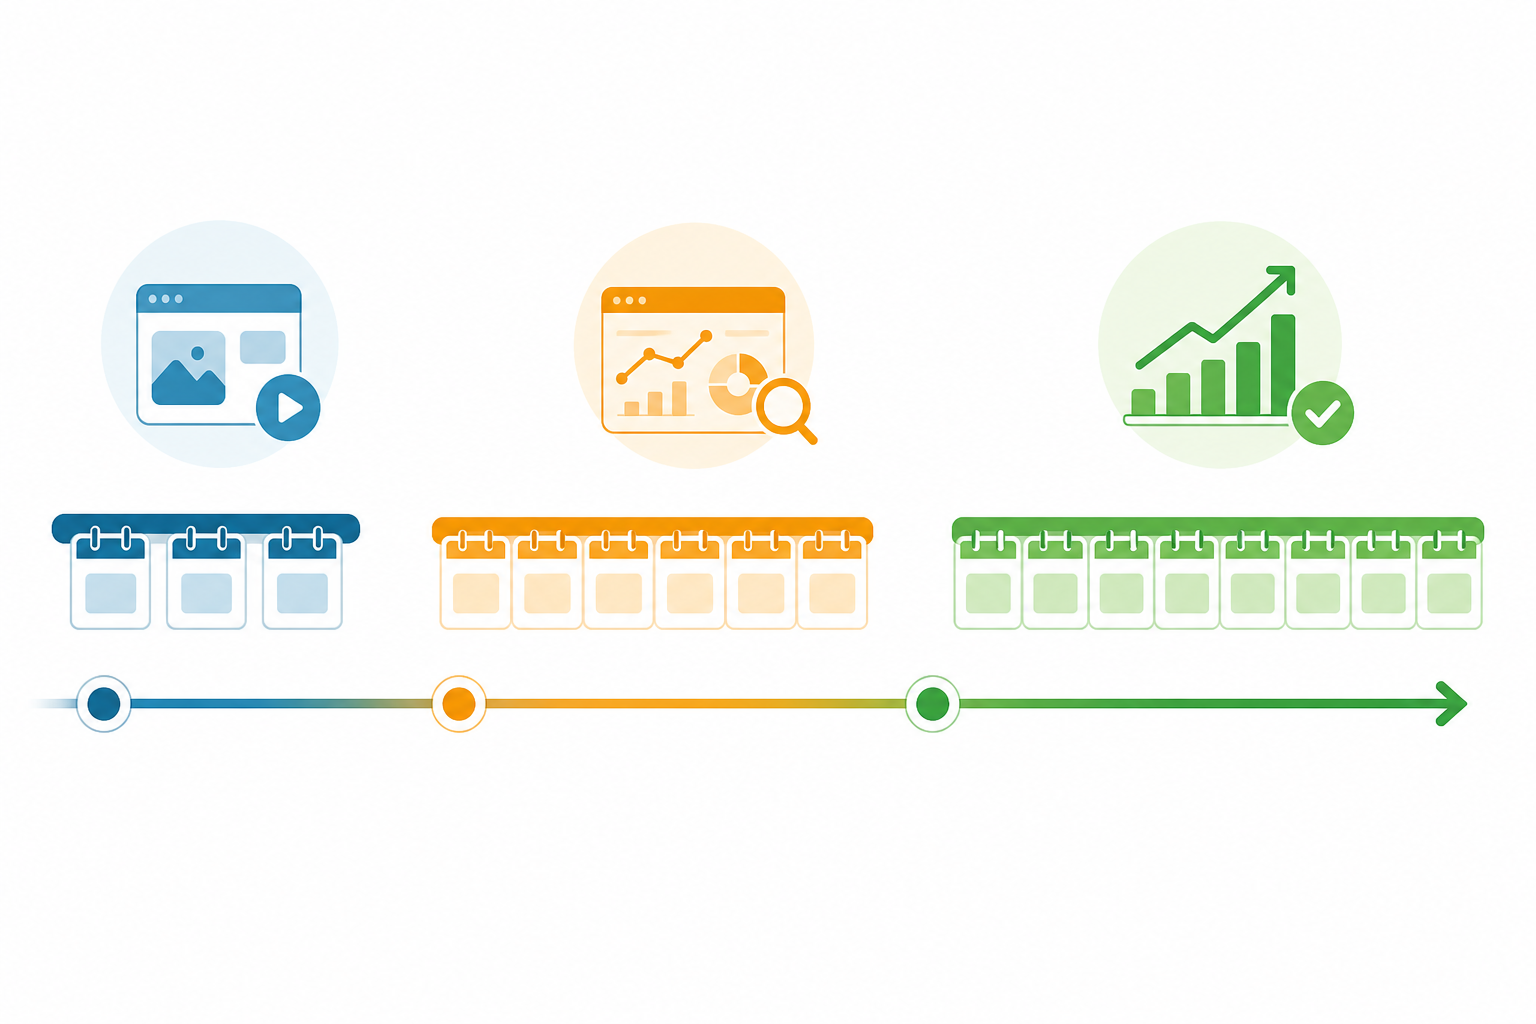
Here's the logic, caveats attached: advertisers generally don't leave budget on creative that's failing. If an ad has only been live a few days, it's most likely one variant in a broader test — low commitment, low confidence, easily killed. That's not necessarily a bad angle. It just hasn't proven anything yet.
Compare that to an ad running continuously for three, four or more weeks with no meaningful changes. On Meta especially, where creative fatigue sets in fast and CPMs climb once an audience gets tired of seeing the same ad, that kind of longevity means something. Advertisers rarely let a genuinely underperforming acquisition ad sit untouched for a month. But they absolutely do let evergreen retargeting ads, brand-safety creative, and low-spend "always-on" campaigns run for months regardless of performance.
Longevity is evidence of persistence, not proof of profitability. Before reading a long run as a winner, check whether the ad looks like top-of-funnel acquisition — a specific claim, an offer, urgency — versus generic retargeting with broad messaging, a soft CTA and no time pressure. The former is a much stronger signal.
There's a third pattern worth watching: ads that disappear and then reappear weeks later. This usually points to seasonal campaigns or budget-cycle behaviour — back-to-school pushes, January fitness offers, Black Friday, end-of-quarter B2B campaigns switched on and off with internal budget periods. Treat each reappearance as a separate observation rather than assuming continuous spend across the gap. You genuinely don't know what happened in between.
| Observed signal | Likely interpretation | Alternative explanation |
|---|---|---|
| Ad live under 2 weeks | Early-stage test | Newly launched evergreen ad, not yet assessed |
| Ad live 3+ weeks, unchanged | Proven angle, sustained budget | Low-spend always-on retargeting ad left untouched |
| Ad disappears then reappears | Seasonal or budget-cycle campaign | Different campaign reusing old creative; library indexing gap |
How to record this without guessing: note the first-seen and last-seen date for each unique creative, not each ad ID. Platforms sometimes assign new IDs to identical creative, which will inflate your count if you're not careful. If a paused ad reappears later, log it as a new observation.
Tracking this by hand across even a handful of competitors is genuinely tedious. You'd need to check each ad library on a schedule, note first-seen dates and manually flag anything still live weeks later. This is exactly the kind of thing a good ad spy tool automates through week-over-week diffs, rather than you rechecking libraries every Monday.
What placement breadth tells you about campaign scale
Duration tells you about time. Placement breadth tells you about scale — but only if you're careful about what you're actually comparing.
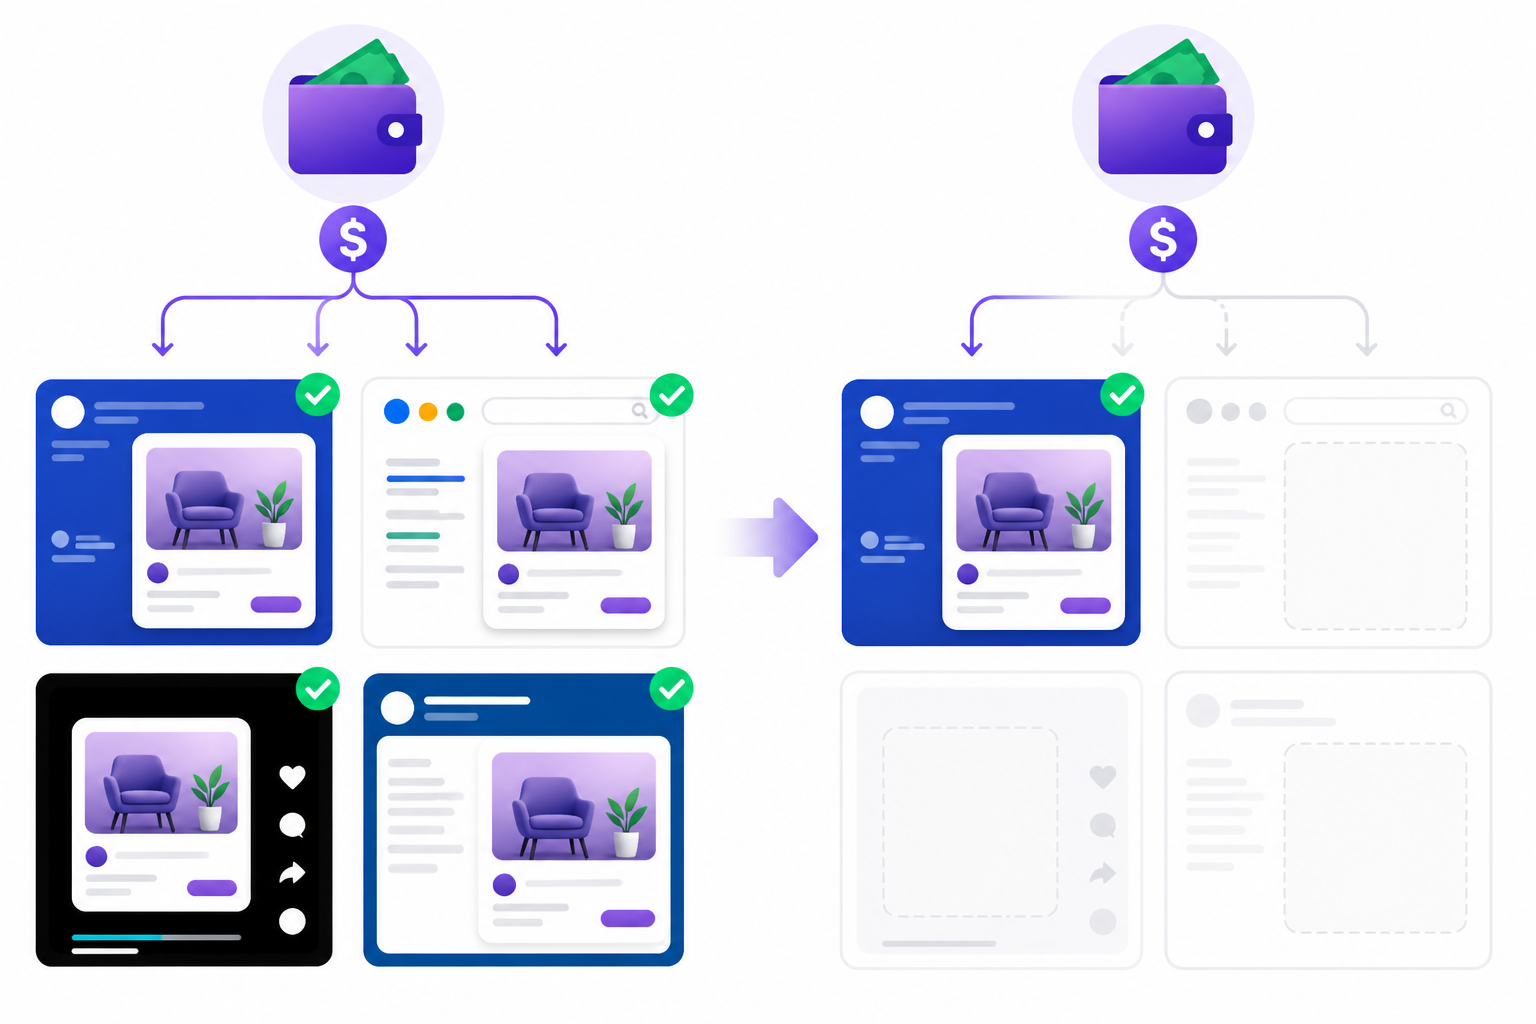
Start within a single platform. An ad running only in Instagram Stories is a different signal from the same creative running simultaneously across Facebook Feed, Instagram Feed, Audience Network and Messenger. Single placement usually suggests a narrow, controlled test. Multi-placement within one platform suggests more confidence and budget behind broader distribution — though it can also just mean the advertiser picked "automatic placements" and let the algorithm decide, which costs nothing extra to set up.
Cross-platform presence is the harder read, and it's where I'd urge some caution. If you find what looks like the same angle on Meta, Google, TikTok and LinkedIn at once, that often points to a coordinated push backed by a real media plan. But "looks like the same angle" is doing a lot of work in that sentence. Public ad libraries don't let you match creative IDs across platforms — you're comparing similar copy, visuals and offers, then inferring they're part of one campaign.
Sometimes they are. Sometimes it's coincidence, or a brand repurposing the same asset for different objectives — awareness on TikTok, conversion on Meta — with very different budgets behind each.
There's also a coverage problem worth naming: Google's Ads Transparency Center doesn't expose placement-level detail the way Meta's Ad Library does, and TikTok's Creative Center has gaps for ads that aren't top performers. If you can't find a competitor's ad on a given platform, that's weak evidence of absence, not proof they're not running it there.
There's a secondary, more reliable read within a single platform. A competitor leaning on Meta's automatic placements is often optimising for volume and reach — casting a wide net and letting the algorithm find efficiency. A competitor running narrow, manual placements is usually optimising for precision, often because they've found a specific audience segment that converts well and don't want to dilute it.
To do this properly, log which platforms show the creative (or a close visual and copy match), note the date you checked because coverage changes, and mark your confidence in any cross-platform match as high, medium or low. Don't treat every match as certain.
Doing this by hand across five competitors and four platforms every week is hours nobody has spare. That's one of the clearest cases for using a dedicated ad spy tool, since automatically detecting a competitor's presence across platforms removes the manual cross-referencing. Just don't mistake "detected on four platforms" for "confirmed same campaign, confirmed large budget." That inference is still yours to make carefully.
Creative iteration as an ad budget proxy
The third signal is the one most marketers overlook, and it's arguably the most nuanced: how often the creative itself changes.
High iteration velocity — new hooks, new thumbnails, new copy variants appearing weekly — often correlates with active budget on a campaign that's being actively optimised. Someone on that team is watching performance data and feeding it back into new creative. But it can also mean the advertiser runs an automated creative-testing matrix, like Meta's Advantage+ creative, which generates variants on its own. An agency might also be contractually required to ship a set number of new assets each month regardless of actual spend level. Iteration speed reflects process as much as budget.
Static creative tells an equally ambiguous story. If the same ad has run unchanged for weeks, it might mean budget has plateaued on a fixed winner, or it might mean the account manager moved on to something else and forgot to refresh it. Both produce identical surface signals, which is exactly why this one needs more nuance than the other two.
What's more useful than raw iteration frequency is what actually changes between versions. If only the CTA or headline shifts while the core visual and offer stay constant, that's iterative optimisation — small tweaks on a formula that's already working, usually backed by a scaling budget. If the entire angle changes — new visual, new offer, new hook — that often means the previous angle died and the advertiser is hunting for a new winner. Distinguishing these two patterns tells you more than simply counting how many versions you've seen.
For methodology, treat a "new variant" as any change to the core hook, visual or offer, not every minor edit. A colour change to a CTA button isn't the same signal as a new headline claim. Miss that distinction and you'll count noise as iteration, inflating your score for ads that haven't meaningfully changed at all.
Spotting this pattern by eye, across dozens of ads and several competitors, isn't realistic as a manual task week after week. That's exactly where a system built to compare creative week over week adds real value — flagging what's new, what's stopped, and what's still scaling.
How to combine ad spy tool signals into a confidence score
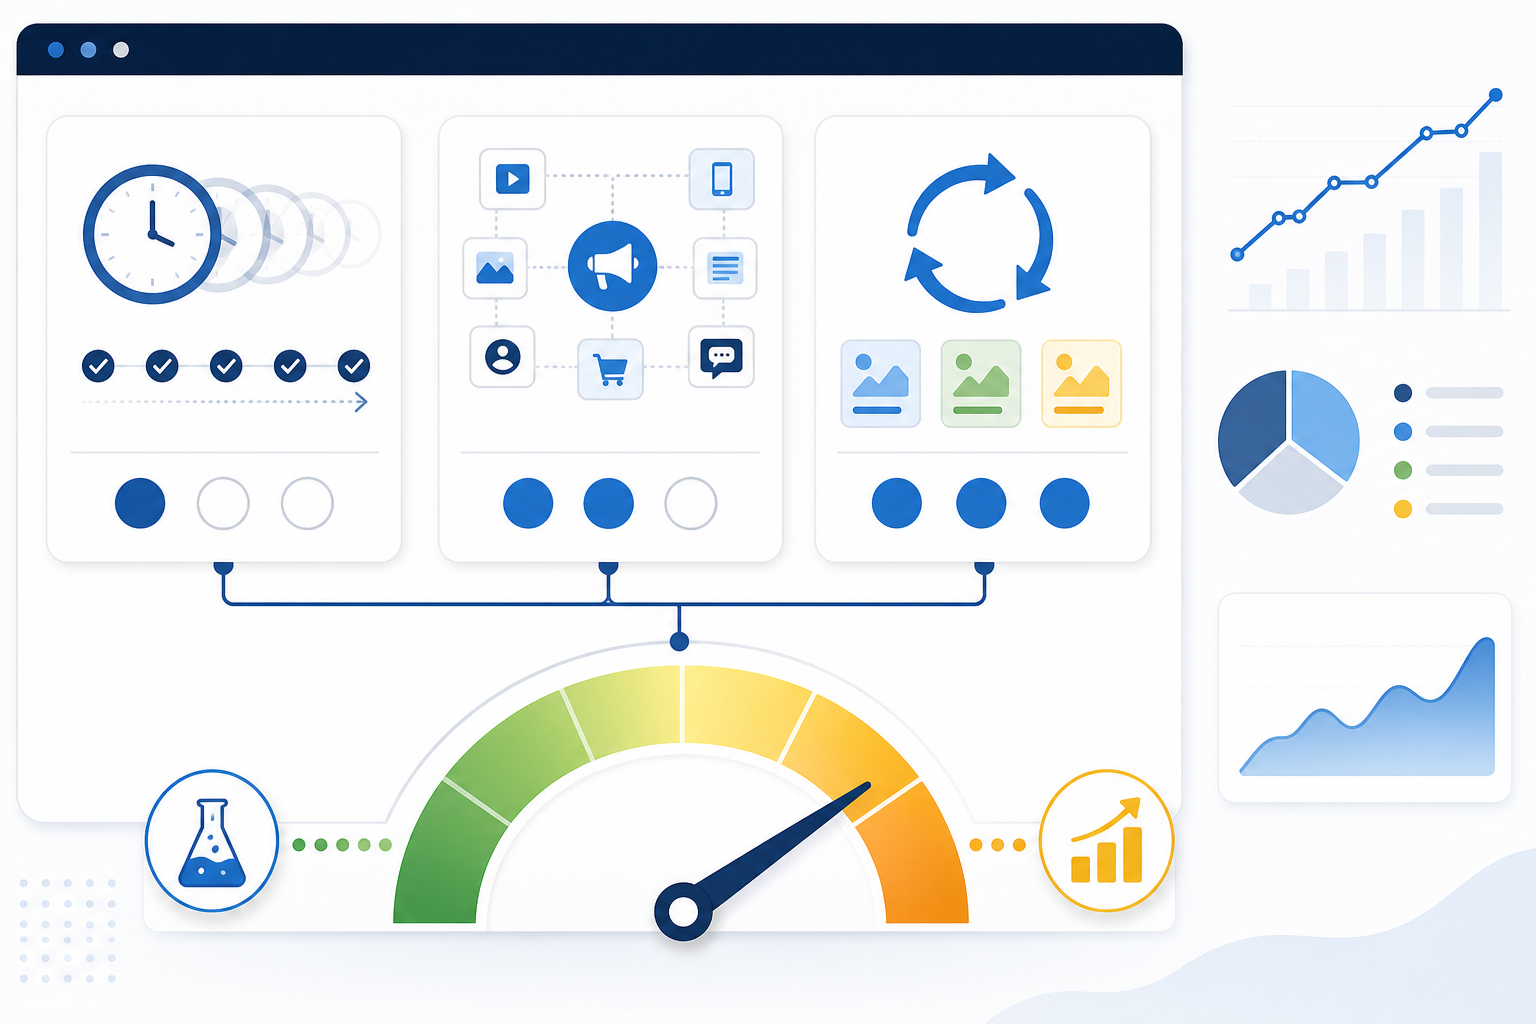
Now let's combine all three signals into something you can actually act on. I want to be precise about what this produces: a prioritisation score, not a spend estimate. It tells you where to spend your limited attention. It does not tell you a competitor's media budget in pounds. Here's the scoring system I use:
Step 1: Score run duration (1–3 points)
- Under 2 weeks = 1 point
- 2–4 weeks = 2 points
- 4+ weeks = 3 points
Step 2: Score placement breadth (1–3 points)
- Single placement = 1 point
- Multi-placement, single platform = 2 points
- Cross-platform presence with a medium-to-high confidence match = 3 points
Step 3: Score iteration pattern (1–3 points)
- No iteration = 1 point
- Minor copy or CTA tweaks = 2 points
- Frequent new hooks, visuals or offers = 3 points
Step 4: Add the three scores together
- 6–9 points = an angle behaving like a well-funded, scaling campaign, worth close attention
- 3–5 points = early-stage testing worth monitoring, but not urgent
Step 5: Track the score weekly, not as a one-off snapshot
Budget signals shift constantly as campaigns mature, scale or get killed. An ad sitting at a 4 this week could be a 7 in a month if it survives that long, and that shift is often the most valuable thing to catch early.
A worked competitor ad example
Say I'm tracking a UK D2C skincare brand and spot a Meta ad making a specific claim ("clears breakouts in 14 days") with a before-and-after visual.
- Run duration: First seen 35 days ago, still live, unchanged offer → 3 points
- Placement breadth: Showing on Facebook Feed and Instagram Feed, plus a visually near-identical ad on TikTok with the same claim (medium-confidence match, different video edit) → 3 points
- Iteration: Two CTA variants seen over the 35 days, core visual and claim unchanged → 2 points
Total: 8/10 — high confidence.
What this score tells me: this angle has survived over a month, is running on at least two platforms, and is being lightly optimised rather than abandoned. Worth studying closely — the specific claim, the visual format, the CTA pattern.
What it doesn't tell me: I don't know if this is a £500-a-month test left running by an under-resourced account or a £50,000-a-month scaled campaign. I don't know if the TikTok version has meaningful spend behind it — the visual match could be coincidental. And I don't know if this angle would work for my brand, audience or price point. The score tells me where to look. It doesn't tell me what to copy or how much to bet.
Using competitor ad signals to prioritise what to test
Once you've got scores across your competitor set, the real value is in how you use them to shape your own creative roadmap — carefully, and without mistaking correlation for a guarantee.
- Rank angles by score first. Don't spend your team's creative resources testing a competitor's abandoned one-week experiment. It may have already proven itself a loser.
- For high-confidence angles (6–9 points), study the details closely, but adapt rather than copy. The hook, offer structure and CTA pattern have likely survived real performance pressure over weeks. Worth understanding deeply. But an angle that works for a competitor with different brand equity, audience, pricing or landing page won't necessarily transfer as-is. Treat it as a hypothesis to test, not a template to lift.
- For low-confidence angles, use them as inspiration, not a direct swipe. They haven't proven anything yet, so treat them as a starting point for your own rapid, low-cost tests rather than something to copy outright.
- Set up ongoing monitoring so you catch the moment an angle graduates. A low-confidence ad crossing into high-confidence territory is often the earliest signal of a genuinely winning angle emerging in your space. That matters even more in a crowded UK market, where several brands often chase the same seasonal moment — Black Friday, January health pushes, back-to-school.
- Build this into a repeatable weekly workflow. Review new ads, check diffs against the previous week, update your scores, flag anything that's crossed the threshold for your team to discuss.
- Keep a running log of what you got wrong. If you scored something as high confidence and it turned out to be a low-spend evergreen ad, note why you misread it. That's how this framework gets more accurate for your specific market over time.
This kind of tracking is exactly what a good ad spy tool should do for you: automatically pull every active ad from a competitor's Meta, Google, TikTok and LinkedIn presence, track exact copy and creative changes, and surface week-over-week diffs so you're not manually revisiting four ad libraries every Monday. At Rival Ads, that's the workflow we've built — you give us a competitor's website, no ad account connections needed, and you get the weekly signals to build your own confidence scores without the manual legwork. The judgement on what to do with the score is still yours. We just make sure you're not spending half a day gathering the inputs.
FAQ: Using an ad spy tool to estimate competitor ad spend
Can I estimate a competitor's ad budget without seeing their account?
Not precisely, and I'd be wary of any tool that claims otherwise. What you can do is combine run duration, placement breadth and creative iteration frequency into a prioritisation score that tells you whether a campaign is behaving like a small test or a scaled, ongoing push. It's directional, not a pound figure. Evergreen retargeting ads and low-spend campaigns can produce the same surface signals as genuine winners, so treat the score as a starting point for investigation, not a verdict.
What does a long ad run duration usually indicate?
An ad that's stayed live for several weeks with minimal changes is generally a sign it's earning its place in the budget, since ad fatigue on Meta makes it costly to leave a genuinely underperforming acquisition ad untouched that long. That said, it's not proof. Evergreen retargeting ads, low-spend always-on campaigns and creative that's simply been forgotten in an account can all stay live for weeks without necessarily performing well. Check whether the ad looks like top-of-funnel acquisition — a specific claim or offer — or generic retargeting before reading too much into duration alone.
How do I prioritise which competitor ad angles to test first?
Score each competitor ad on run duration, placement breadth and iteration frequency, then rank by total score. High-scoring ads have likely survived real performance pressure and deserve closer study; low-scoring ones are still early-stage and better used as directional inspiration than as templates to copy directly. Either way, adapt the angle to your own brand, audience and offer rather than assuming it'll transfer unchanged — what worked for them was shaped by factors you can't fully see from the outside.